

Trading strategies are essential for success in the financial markets. They help traders make informed decisions.
The world of trading can be overwhelming. With numerous strategies available, finding the right one is crucial. The right strategy can lead to consistent profits and reduced risks. Whether you’re a beginner or a seasoned trader, understanding various strategies is important.
In this post, we’ll explore different trading strategies. We aim to help you choose the best one for your needs. Let’s dive into the essentials of trading strategies. Get ready to enhance your trading skills.
Introduction To Trading Strategies
Investors and traders use various methods to achieve their financial goals. These methods, known as trading strategies, help guide decisions in the market. By understanding different trading strategies, you can improve your chances of success. This article introduces you to the basics of trading strategies.
What Are Trading Strategies?
Trading strategies are plans designed to buy and sell financial instruments. These plans aim to achieve a profit. Strategies vary from simple to complex. They are based on various factors such as market trends, technical indicators, and risk management.
There are many types of trading strategies. Each has its own approach and goals. Here are some of the most common types:
- Day Trading: Buying and selling within the same day.
- Swing Trading: Holding positions for several days to weeks.
- Algorithmic Trading: Using computer programs to execute trades.
- Investment Strategies: Long-term plans for building wealth.
Importance Of Market Analysis
Market analysis is crucial for effective trading. It involves studying market trends and technical indicators. This helps traders make informed decisions. There are two main types of market analysis:
| Technical Analysis | Fundamental Analysis |
|---|---|
| Focuses on price and volume data | Looks at financial statements and economic factors |
| Uses charts and technical indicators | Evaluates company performance and market conditions |
Risk Management In Trading
Risk management is a key part of any trading strategy. It helps protect against potential losses. Here are some common risk management techniques:
- Setting stop-loss orders
- Diversifying your portfolio
- Using position sizing to limit exposure
Portfolio Diversification
Diversification involves spreading investments across various assets. This reduces risk. A diversified portfolio can include stocks, bonds, commodities, and more. Diversification helps balance risk and reward.
Understanding trading strategies is vital for success in the markets. By learning about different techniques, you can make better decisions. Always remember to analyze the market and manage your risks effectively.
Types Of Trading Strategies
Trading strategies are essential for anyone looking to navigate the financial markets. These strategies help traders make informed decisions, manage risks, and optimize their investments. There are various types of trading strategies, each with its unique approach and techniques. Below, we explore some of the most popular types of trading strategies.
Day Trading
Day trading involves buying and selling financial instruments within the same trading day. This strategy is popular due to its potential for quick profits. Day traders often rely on technical indicators and chart patterns to make decisions.
Key aspects of day trading include:
- Volatility Trading: Day traders thrive on market volatility. They look for stocks or assets with significant price movements.
- Market Analysis: Successful day trading requires constant market analysis. Traders use charts, news, and financial reports to stay informed.
- Risk Management: Setting stop-loss orders is crucial. This limits potential losses and protects the trader’s capital.
Day traders need a well-structured trading plan. This includes defined entry and exit points, as well as clear risk management rules. They also need a thorough understanding of trading psychology to handle the stress of rapid trading.
Swing Trading
Swing trading is a medium-term strategy. It involves holding positions for several days to weeks. The goal is to profit from price swings or market corrections.
Key aspects of swing trading include:
- Chart Patterns: Swing traders use chart patterns to identify potential market reversals or continuations.
- Technical Indicators: Indicators like moving averages and Relative Strength Index (RSI) help in decision-making.
- Backtesting Strategies: Traders often backtest their strategies using historical data to ensure effectiveness.
Swing trading requires a good understanding of market analysis and trading plans. Traders need to be patient and disciplined, as they may have to wait for the right market conditions to enter or exit a trade.
Scalping
Scalping is a high-frequency trading strategy. It involves making dozens or even hundreds of trades within a single day. The goal is to profit from small price changes.
Key aspects of scalping include:
- Technical Indicators: Scalpers rely heavily on indicators like Bollinger Bands and MACD for quick decision-making.
- Risk Management: Due to the high number of trades, strict risk management is essential. This often involves using tight stop-loss orders.
- Trading Psychology: Scalping requires a strong mindset. Traders must remain focused and avoid emotional decisions.
Scalping is best suited for those who can dedicate significant time to trading. It demands quick reflexes and the ability to make split-second decisions.
Position Trading
Position trading is a long-term strategy. Traders hold positions for months or even years. The focus is on fundamental analysis and long-term market trends.
Key aspects of position trading include:
- Investment Techniques: Position traders often use fundamental analysis to assess a company’s long-term potential.
- Market Analysis: They consider macroeconomic factors, industry trends, and company financials.
- Risk Management: Position traders use diversified portfolios to spread risk.
Position traders need patience and a deep understanding of the financial markets. They often use backtesting strategies to validate their long-term investment techniques. This strategy is ideal for those who prefer a less hands-on approach to trading.
Technical Analysis Techniques
Trading strategies involve various methods to predict market movements and make profitable trades. One of these methods is Technical Analysis Techniques. This approach uses historical price data, volume, and other market information to forecast future price movements. It helps traders make informed decisions. Below are some key techniques used in technical analysis.
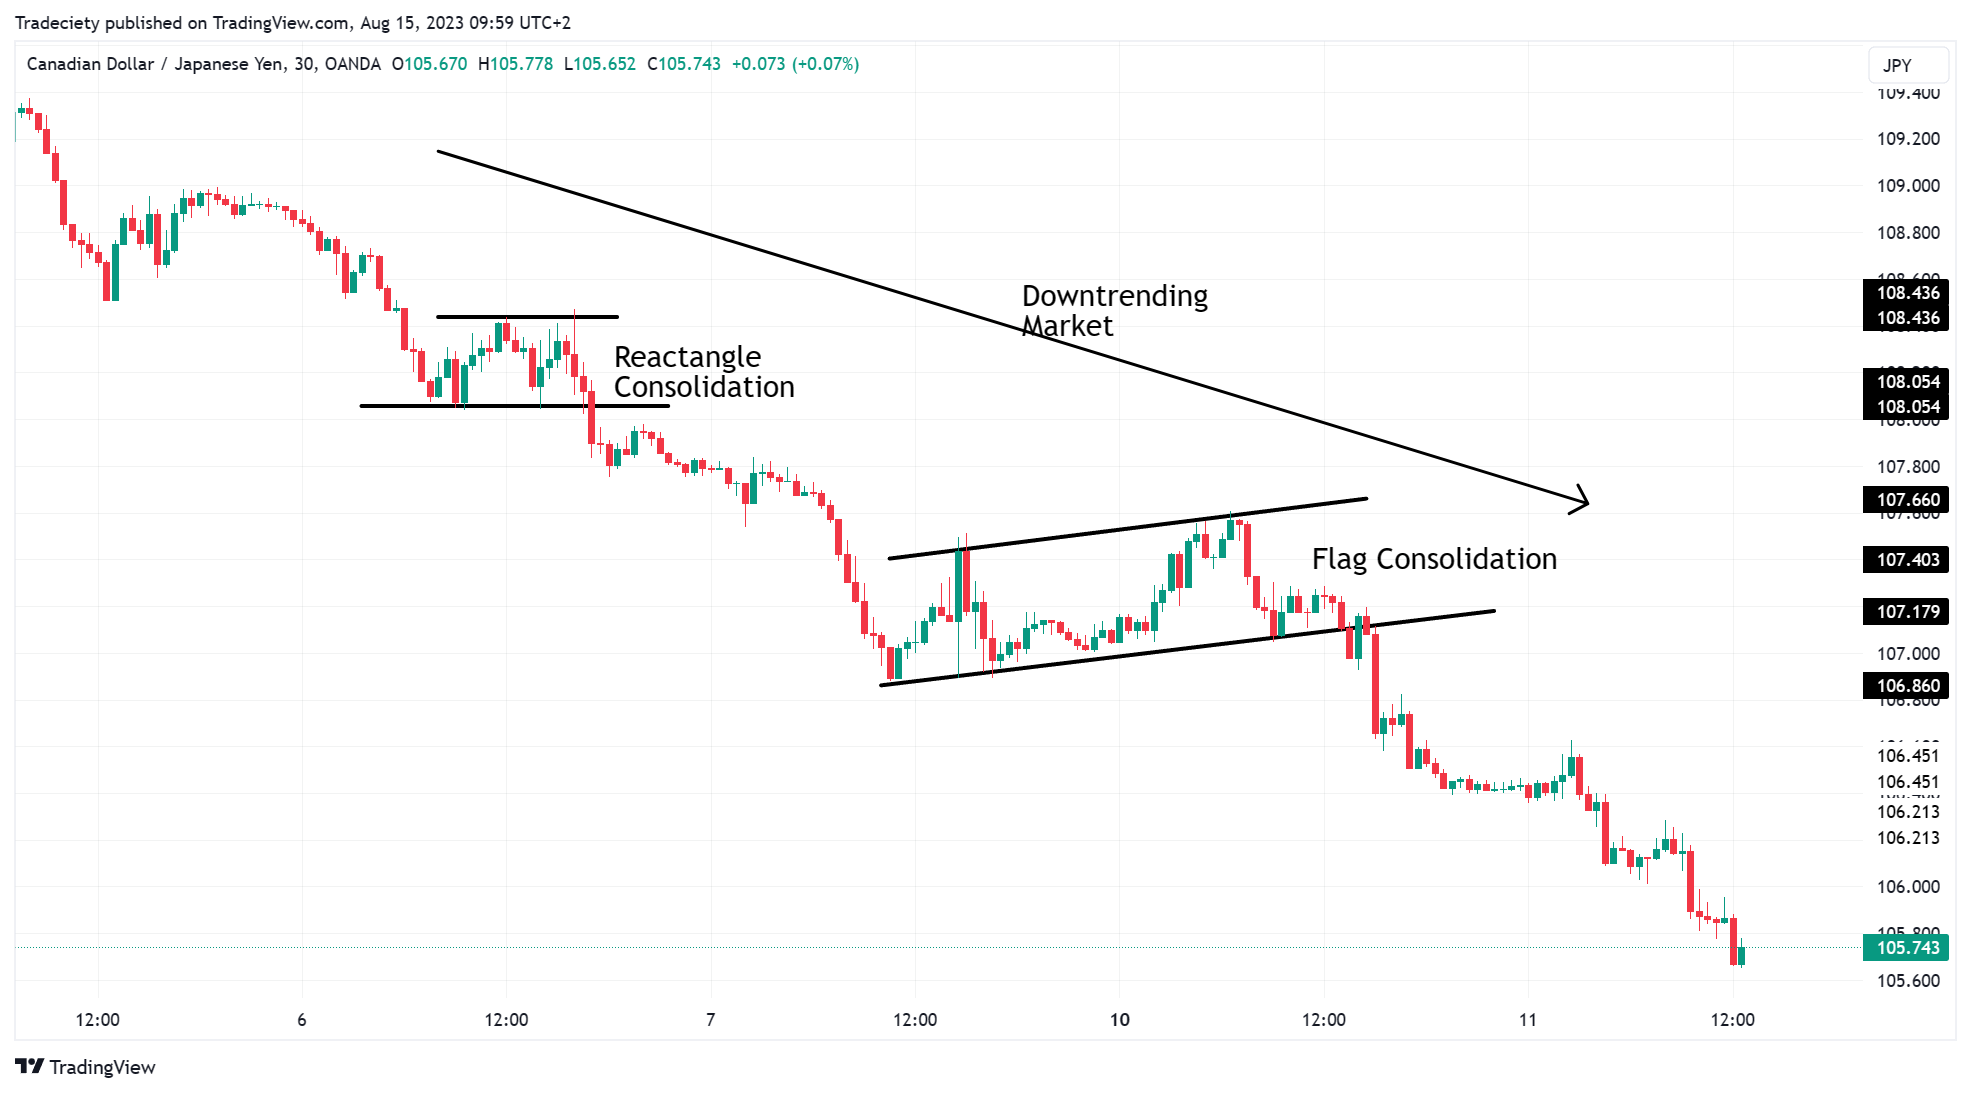
Chart Patterns
Chart patterns are visual representations of market behavior. They help traders understand the potential direction of market prices. These patterns form due to the collective buying and selling activity of market participants. Here are some common chart patterns:
- Head and Shoulders: Indicates a potential reversal in the market trend.
- Double Top and Double Bottom: Suggests a strong reversal signal.
- Triangles (Ascending, Descending, and Symmetrical): Show periods of consolidation before a breakout.
These patterns are essential for day trading and swing trading. They offer insights into market volatility and risk management. Recognizing these patterns can help traders identify entry and exit points. It also aids in setting stop-loss and take-profit levels. Here’s a simple table to illustrate the signals of some common chart patterns:
| Pattern | Signal |
|---|---|
| Head and Shoulders | Trend Reversal |
| Double Top | Bearish Reversal |
| Double Bottom | Bullish Reversal |
Indicators
Indicators are mathematical calculations based on historical price, volume, or open interest. They help traders understand market conditions and forecast future price movements. Here are some popular indicators:
- Moving Averages (MA): Smooth out price data to identify trends. Simple Moving Average (SMA) and Exponential Moving Average (EMA) are common types.
- Relative Strength Index (RSI): Measures the speed and change of price movements. It helps identify overbought or oversold conditions.
- Fibonacci Retracement: Uses horizontal lines to indicate areas of support and resistance at the key Fibonacci levels before the price continues in the original direction.
Using these indicators helps in risk management and improves trading psychology. It is essential to combine multiple indicators to confirm signals before making a trade. Here’s an example of how different indicators can signal market conditions:
| Indicator | Signal |
|---|---|
| MA Crossover | Bullish or Bearish Trend |
| RSI | Overbought or Oversold |
| Fibonacci Levels | Support and Resistance |
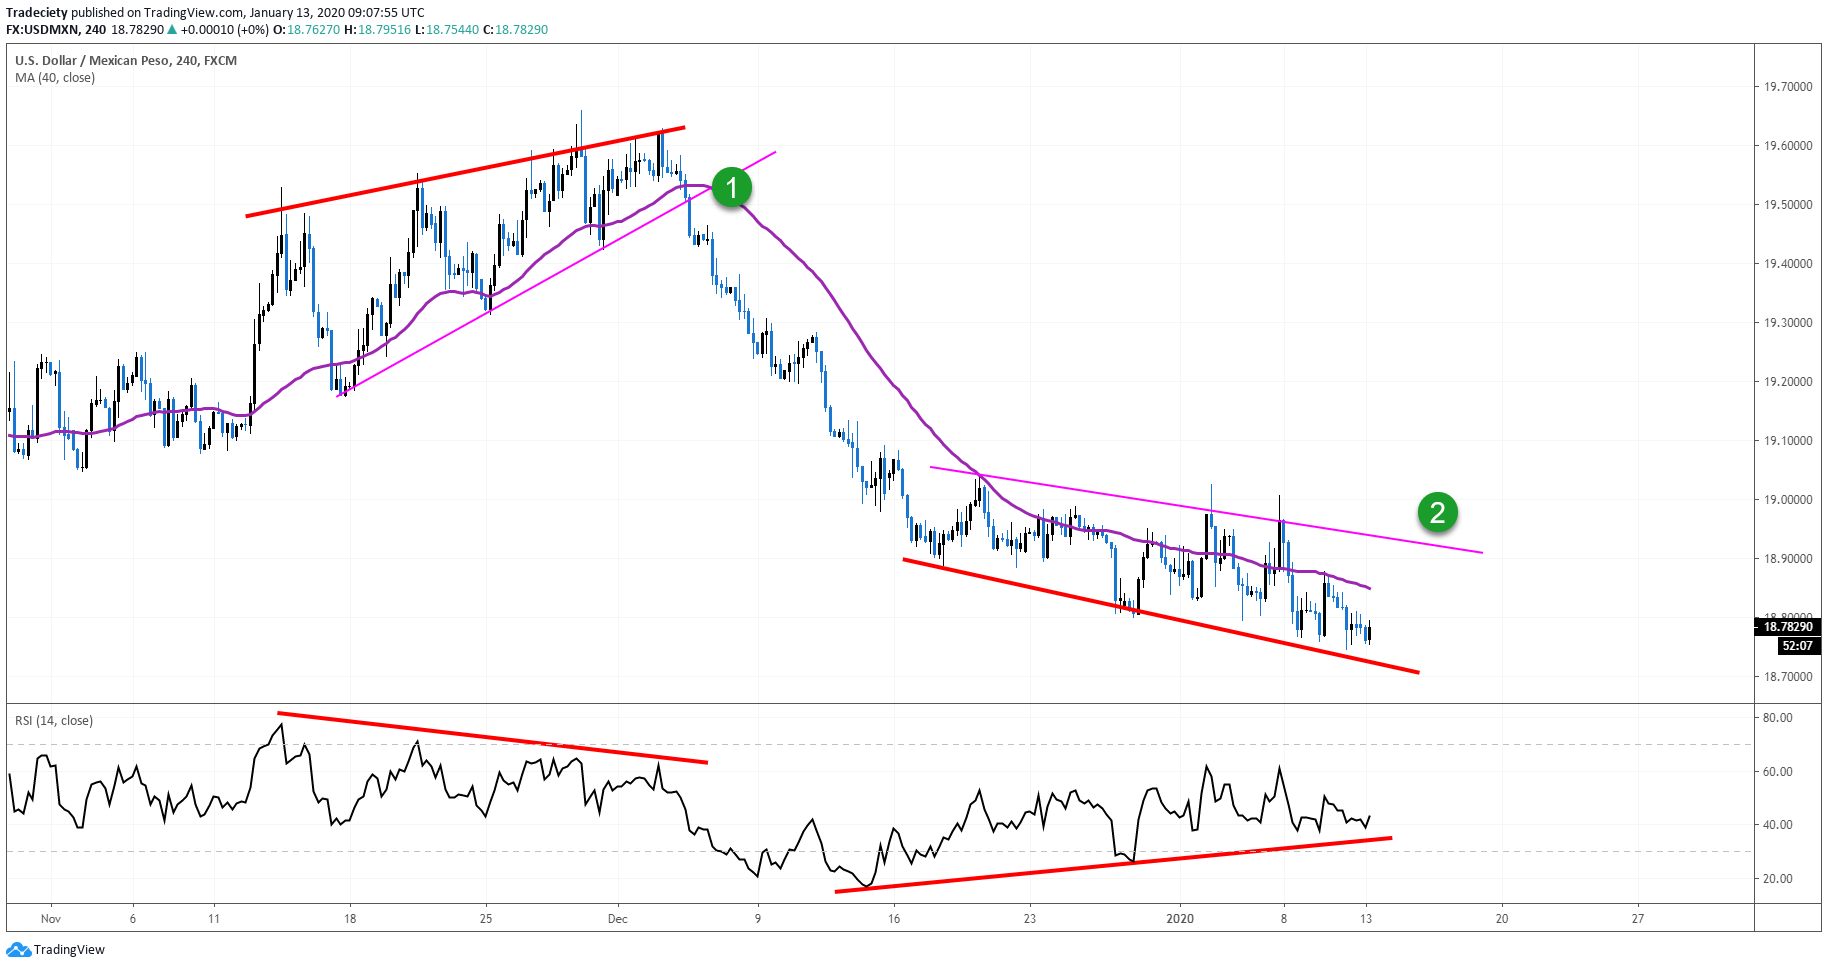
Support And Resistance
Support and Resistance levels are critical concepts in technical analysis. They represent price levels where a stock or asset struggles to move above or below. Support levels indicate where the price tends to find a floor, while resistance levels are where the price faces a ceiling. Understanding these levels helps in day trading and swing trading:
- Support Levels: A price point where a downtrend can be expected to pause due to a concentration of demand.
- Resistance Levels: A price point where an uptrend can be expected to pause due to a concentration of supply.
- Trend Lines: Help identify the direction of the market and potential support and resistance levels.
These levels are vital for making buy and sell decisions. They also help in setting stop-loss orders to minimize risk. Here’s a brief table to explain the concept:
| Type | Description |
|---|---|
| Support | Price level where downtrend pauses |
| Resistance | Price level where uptrend pauses |
| Trend Lines | Lines that show the market direction |

Credit: www.youtube.com
Fundamental Analysis Insights
Trading strategies involve various methods to analyze and predict market movements. One of the key methods is fundamental analysis. This approach helps traders understand the intrinsic value of assets by examining economic indicators, company financials, and market sentiment. Here, we delve into the key aspects of fundamental analysis to provide deeper insights into its application in trading strategies.
Economic Indicators
Economic indicators are vital for predicting market trends and developing effective trading strategies. They offer insights into the economic health of a country, which can directly impact the financial markets.
Here are some key economic indicators to watch:
- Gross Domestic Product (GDP): Measures the total economic output of a country. A rising GDP indicates economic growth, while a falling GDP suggests economic decline.
- Inflation Rate: Shows the rate at which prices for goods and services rise. High inflation can erode purchasing power, affecting consumer spending and investment strategies.
- Unemployment Rate: Indicates the percentage of the labor force that is unemployed. High unemployment can signal economic distress, influencing market sentiment.
- Interest Rates: Set by central banks, they influence borrowing costs. Lower rates can stimulate economic activity, while higher rates can slow it down.
By monitoring these indicators, traders can generate valuable trading signals to guide their investment decisions. For instance, an improving GDP might signal a bullish market, prompting traders to buy assets.
Company Financials
Company financials offer a detailed view of a firm’s health and performance. Analyzing these can help traders make informed decisions about buying or selling stocks.
Key components to examine include:
- Income Statement: Shows the company’s revenue, expenses, and profit over a period. A growing profit margin indicates a strong business model.
- Balance Sheet: Lists the company’s assets, liabilities, and equity. A healthy balance sheet with more assets than liabilities is a positive sign.
- Cash Flow Statement: Provides insights into the company’s cash inflows and outflows. Positive cash flow indicates good liquidity.
Here’s a simple table summarizing these components:
| Component | Key Metric | Significance |
|---|---|---|
| Income Statement | Revenue, Expenses, Profit | Measures profitability |
| Balance Sheet | Assets, Liabilities, Equity | Indicates financial health |
| Cash Flow Statement | Cash Inflows, Outflows | Shows liquidity |
By examining these financial statements, traders can identify strong companies worth investing in. This forms a crucial part of market analysis and helps with risk management.
Market Sentiment
Market sentiment reflects the overall attitude of investors towards a particular market or asset. It can greatly influence market movements and trading techniques.
Factors affecting market sentiment include:
- News and Media: News about the economy, politics, or companies can sway investor sentiment. Positive news can lead to a bullish market, while negative news can cause a bearish trend.
- Investor Behavior: The actions and reactions of investors to market events can create trends. Herd behavior, where investors follow the majority, can amplify market movements.
- Market Trends: Observing patterns in price action can provide clues about market sentiment. An upward trend may indicate positive sentiment, while a downward trend suggests negative sentiment.
Using sentiment analysis, traders can gauge the mood of the market and adjust their strategies accordingly. For example, during high volatility, understanding market sentiment can help traders decide whether to enter or exit trades.
Incorporating these insights into fundamental analysis enhances trading strategies, making them more robust and data-driven. This holistic approach can improve decision-making and increase the chances of success in the financial markets.
Risk Management Approaches
Successful trading strategies depend on effective risk management approaches. Traders must manage their risk to protect their capital and ensure long-term success. Implementing robust risk management techniques helps traders navigate the markets with confidence. Key approaches include stop-loss orders, position sizing, and diversification. Let’s explore these concepts in detail.
Stop-loss Orders
Stop-loss orders are essential tools for risk management in trading. A stop-loss order automatically sells a security when it reaches a predetermined price. This helps traders limit their losses and control risk.
Consider the following benefits of stop-loss orders:
- Protection Against Large Losses: Stops prevent severe financial setbacks by capping potential losses.
- Emotional Control: Stops remove the emotional aspect of decision-making, ensuring disciplined trading.
- Flexibility: Traders can adjust stop-loss levels based on market analysis and volatility measures.
Here’s an example of how a stop-loss order might look:
| Stock | Purchase Price | Stop-Loss Price | Potential Loss |
|---|---|---|---|
| XYZ Corp | $100 | $90 | $10 |
By setting a stop-loss order at $90, a trader limits their potential loss to $10 per share if the stock’s price falls. Effective use of stop-loss orders is crucial for portfolio management and maintaining a healthy risk-reward ratio.
Position Sizing
Position sizing determines the number of shares or contracts to trade in a given position. Proper position sizing ensures that traders do not overexpose themselves to any single trade, balancing risk and potential reward.
Factors to consider in position sizing include:
- Account Size: Larger accounts can afford to take on slightly more risk, while smaller accounts require more conservative sizing.
- Risk Per Trade: Many traders limit risk to a specific percentage of their account, often 1-2%.
- Volatility Measures: Volatile assets may require smaller positions to manage risk effectively.
Here’s a simple formula for calculating position size:
Position Size = (Account Size Risk Per Trade) / (Entry Price - Stop-Loss Price)
For instance, if a trader has a $10,000 account, wishes to risk 2% per trade, and their stop-loss is set $5 below the entry price, they would calculate position size as follows:
Position Size = ($10,000 0.02) / $5 = 40 shares
This approach ensures a balanced and disciplined trading psychology, aligning with sound risk management principles.
Diversification
Diversification is a risk management strategy that involves spreading investments across various assets to reduce exposure to any single asset or risk. By diversifying, traders can protect their portfolios from significant losses due to one underperforming asset.
Benefits of diversification include:
- Reduced Volatility: Diversified portfolios tend to be less volatile, providing a smoother performance over time.
- Improved Risk-Reward Ratio: Proper asset allocation can enhance returns while minimizing risk.
- Market Analysis: Diversification encourages traders to explore different markets and sectors.
Consider a portfolio with the following asset allocation:
| Asset | Allocation Percentage | Example Holdings |
|---|---|---|
| Stocks | 50% | Tech, Healthcare, Finance |
| Bonds | 30% | Government, Corporate |
| Commodities | 10% | Gold, Oil |
| Real Estate | 10% | REITs |
By diversifying across different asset classes, traders can mitigate risks associated with specific sectors or markets. This approach aligns with trend following and other trading tactics, promoting balanced and resilient portfolio management.
Credit: tradeciety.com
Psychology Of Trading
Understanding trading strategies requires more than just knowledge of the markets. The psychology of trading plays a crucial role in successful trading. Traders must manage their emotions, recognize cognitive biases, and handle stress effectively. These aspects can make or break a trader’s success.
Emotional Discipline
Emotional discipline is vital in trading. It helps traders stick to their trading techniques and avoid impulsive decisions. Here are some key points:
- Stay Calm: Keep emotions in check to make rational decisions.
- Follow Your Plan: Stick to your investment approaches and avoid deviating under pressure.
- Accept Losses: Understand that losses are part of trading. Learn from them rather than reacting emotionally.
Emotional discipline also involves managing expectations. Traders often expect quick profits, leading to frustration when results take time. Patience and persistence are crucial. Developing a routine can help maintain discipline. Regularly reviewing your market analysis and risk management strategies ensures you stay on track.
Cognitive Biases
Cognitive biases affect trading decisions. Recognizing these biases can improve your decision-making strategies. Common cognitive errors in trading include:
- Overconfidence Bias: Believing you know more than you do, leading to risky trades.
- Confirmation Bias: Seeking information that confirms your beliefs, ignoring contradictory data.
- Loss Aversion: Preferring to avoid losses rather than acquiring gains, leading to holding onto losing positions for too long.
Traders should be aware of these biases and strive to mitigate them. Keeping a trading journal can help identify patterns in your behavior. Reviewing past trades and analyzing mistakes can lead to better trading discipline. Education in behavioral finance can also provide insights into how emotions influence market behavior.
Stress Management
Trading can be stressful. Effective stress management is crucial to maintain clear thinking. Here are some strategies:
- Regular Breaks: Taking breaks helps maintain focus and reduces stress.
- Physical Activity: Exercise can reduce stress and improve overall well-being.
- Mindfulness Practices: Techniques like meditation can help manage stress levels.
Maintaining a balanced lifestyle supports better decision-making. Ensure you have a good work-life balance. Avoid overtrading and take time to relax. Effective stress management can enhance emotional intelligence in trading, leading to better outcomes. Implementing these strategies can create a more sustainable trading practice.
Backtesting Strategies
Trading strategies are essential for any trader looking to maximize profits and minimize risks. One critical aspect of developing effective trading strategies is backtesting. Backtesting strategies involve testing a trading model on historical data to see how it would have performed in real market conditions. This helps traders refine their models before risking real money. Let’s dive into the key components of backtesting strategies.
Data Collection
Data collection is the first step in backtesting strategies. Accurate and comprehensive data is essential for reliable backtesting. Traders need historical data on various financial instruments. This includes stock prices, forex rates, commodity prices, and more. The quality of the data can significantly impact the results of the backtest.
Important aspects of data collection include:
- Historical Price Data: Collecting price data for the assets you want to test.
- Volume Data: Understanding the trading volume helps in assessing liquidity.
- Technical Indicators: Indicators like moving averages, RSI, and MACD.
- Market Events: Events like earnings reports, economic releases, and geopolitical events.
Using reliable data sources is critical. Financial institutions, market data providers, and exchanges offer historical data. For algorithmic trading, ensure the data is clean and free from errors.
In the table below, find an example of different data points collected for backtesting:
| Data Point | Description |
|---|---|
| Open Price | Opening price of the asset for the day |
| Close Price | Closing price of the asset for the day |
| Volume | Total number of shares traded |
| High/Low | Highest and lowest price of the asset |
Simulation Techniques
Simulation techniques are used to replicate trading conditions and apply trading models to historical data. This helps in assessing how trading algorithms would have performed in the past.
Common simulation techniques include:
- Walk-Forward Testing: A technique where the model is trained on a subset of data and tested on the following period.
- Monte Carlo Simulation: This involves running multiple simulations to understand the range of possible outcomes.
- Bootstrap Aggregation: Also known as bagging, this technique helps in improving the stability of the model.
Traders use various software tools for simulations. Examples include Python libraries like pandas and NumPy, trading platforms like MetaTrader, and specialized backtesting software.
Here is a simple code snippet in Python for a basic backtesting simulation:
import pandas as pd

# Load historical data
data = pd.read_csv('historical_data.csv')

# Define a simple moving average strategy
data['SMA'] = data['Close'].rolling(window=20).mean()

# Generate trading signals
data['Signal'] = 0
data['Signal'][20:] = np.where(data['Close'][20:] > data['SMA'][20:], 1, 0)

# Calculate returns
data['Returns'] = data['Close'].pct_change()  data['Signal'].shift(1)

# Output the results
print(data[['Date', 'Close', 'SMA', 'Signal', 'Returns']])
Performance Metrics
Performance metrics help in evaluating the effectiveness of trading models. These metrics provide insights into the profitability, risk, and efficiency of the strategies.
Key performance metrics include:
- Return on Investment (ROI): Measures the profitability of the strategy.
- Sharpe Ratio: Assesses the risk-adjusted return.
- Drawdown: The peak-to-trough decline in the portfolio value.
- Win Rate: The percentage of winning trades.
- Sortino Ratio: Similar to the Sharpe Ratio, but focuses on downside risk.
Using these metrics, traders can refine their models to improve performance. For example, a high Sharpe Ratio indicates a good risk-adjusted return. A low drawdown suggests minimal losses during market downturns.
Below is an example table of performance metrics for a trading strategy:
| Metric | Value |
|---|---|
| Return on Investment (ROI) | 15% |
| Sharpe Ratio | 1.5 |
| Drawdown | 5% |
| Win Rate | 60% |
| Sortino Ratio | 2.0 |
These performance metrics are crucial for traders in quantitative finance. They help in making informed decisions and improving financial forecasting and risk management.
Credit: tradeciety.com
Future Trends In Trading
Trading strategies are evolving rapidly with technology. Future trends in trading promise more efficiency, precision, and accessibility. Understanding these trends is crucial for traders aiming to stay ahead. Let’s explore some key trends shaping the future of trading.
Algorithmic Trading
Algorithmic trading uses trading algorithms to execute trades. These algorithms follow predefined rules. They can analyze large data sets quickly. This allows traders to capitalize on market opportunities.
Benefits of algorithmic trading include:
- Speed: Trades are executed in milliseconds.
- Accuracy: Algorithms reduce human error.
- Efficiency: It handles large volumes of trades simultaneously.
- Cost-effective: It reduces transaction costs.
Here is a comparison of traditional and algorithmic trading:
| Aspect | Traditional Trading | Algorithmic Trading |
|---|---|---|
| Speed | Slower | Faster |
| Accuracy | Prone to errors | Less error-prone |
| Volume | Limited | High |
| Cost | Higher | Lower |
Algorithmic trading is essential for portfolio management and risk management strategies. It allows traders to diversify their investments and minimize losses.
Ai In Trading
AI in trading is transforming the industry. AI systems can predict market movements. They use machine learning in finance to analyze data and learn from it.
Key applications of AI in trading:
- Sentiment Analysis: AI analyzes news and social media to gauge market sentiment.
- Quantitative Analysis: AI processes vast amounts of historical data to identify patterns.
- Automated Trading: AI executes trades based on real-time data.
AI enhances trading systems by providing:
- Predictive Analytics: Forecasting future market trends.
- Adaptive Algorithms: Adjusting strategies based on market changes.
- Behavioral Finance: Understanding human behavior to predict market reactions.
AI-driven trading systems are more adaptive and efficient. They help traders make better decisions and optimize their portfolios.
Social Trading
Social trading is gaining popularity. It allows traders to follow and copy the trades of experts. This approach leverages the power of crowd trading.
Features of social trading include:
- Transparency: Traders can see the performance of others.
- Accessibility: New traders can learn from experienced ones.
- Community: It fosters a sense of community among traders.
Benefits of social trading:
- Learning: Beginners learn effective strategies.
- Risk Management: Copying successful traders reduces risks.
- Diversification: Traders can diversify their investments.
Social trading platforms provide tools for analyzing and copying trades. They offer insights into market trends and help in portfolio management. This trend democratizes trading, making it accessible to everyone.
Frequently Asked Questions
What Are Trading Strategies?
Trading strategies are systematic plans for buying and selling assets. They aim to generate profits. These strategies consider market conditions and risk tolerance.
How Do Trading Strategies Work?
Trading strategies use technical analysis and market data. They help traders make informed decisions. The goal is to maximize returns while minimizing risks.
Why Are Trading Strategies Important?
Trading strategies help manage risks and improve consistency. They provide a structured approach to trading. This reduces emotional decision-making and enhances profitability.
What Are Common Types Of Trading Strategies?
Common trading strategies include day trading, swing trading, and trend following. Each has its own rules and goals. They cater to different trading styles and risk levels.
Conclusion
Effective trading strategies can significantly improve your investment success. Always stay informed and adaptable. Diversify your portfolio to manage risk better. Consistency and patience are key in trading. Learn from your experiences and refine your approach. Keep an eye on market trends and adjust your strategies accordingly.
Remember, no strategy is foolproof, so be prepared for losses. Continuous learning helps improve your trading skills. Finally, stay disciplined and stick to your plan. Happy trading!